Home > Features > Audio Analysis
Audio Analysis
librosa-powered feature extraction with D3.js visualizations.
Table of Contents
- Overview
- Feature Categories
- AnalyzerPort
- Analysis Pipeline
- D3.js Visualizations
- AnalysisResult Schema
- Querying Analysis Data
Overview
Audio analysis extracts musical features from downloaded audio files using Python’s librosa library. Features are stored in the analysis_results table and rendered as interactive D3.js visualizations in the track detail view.
The analysis runs as an Oban background job (:analysis queue, concurrency: 2) after a track is downloaded.
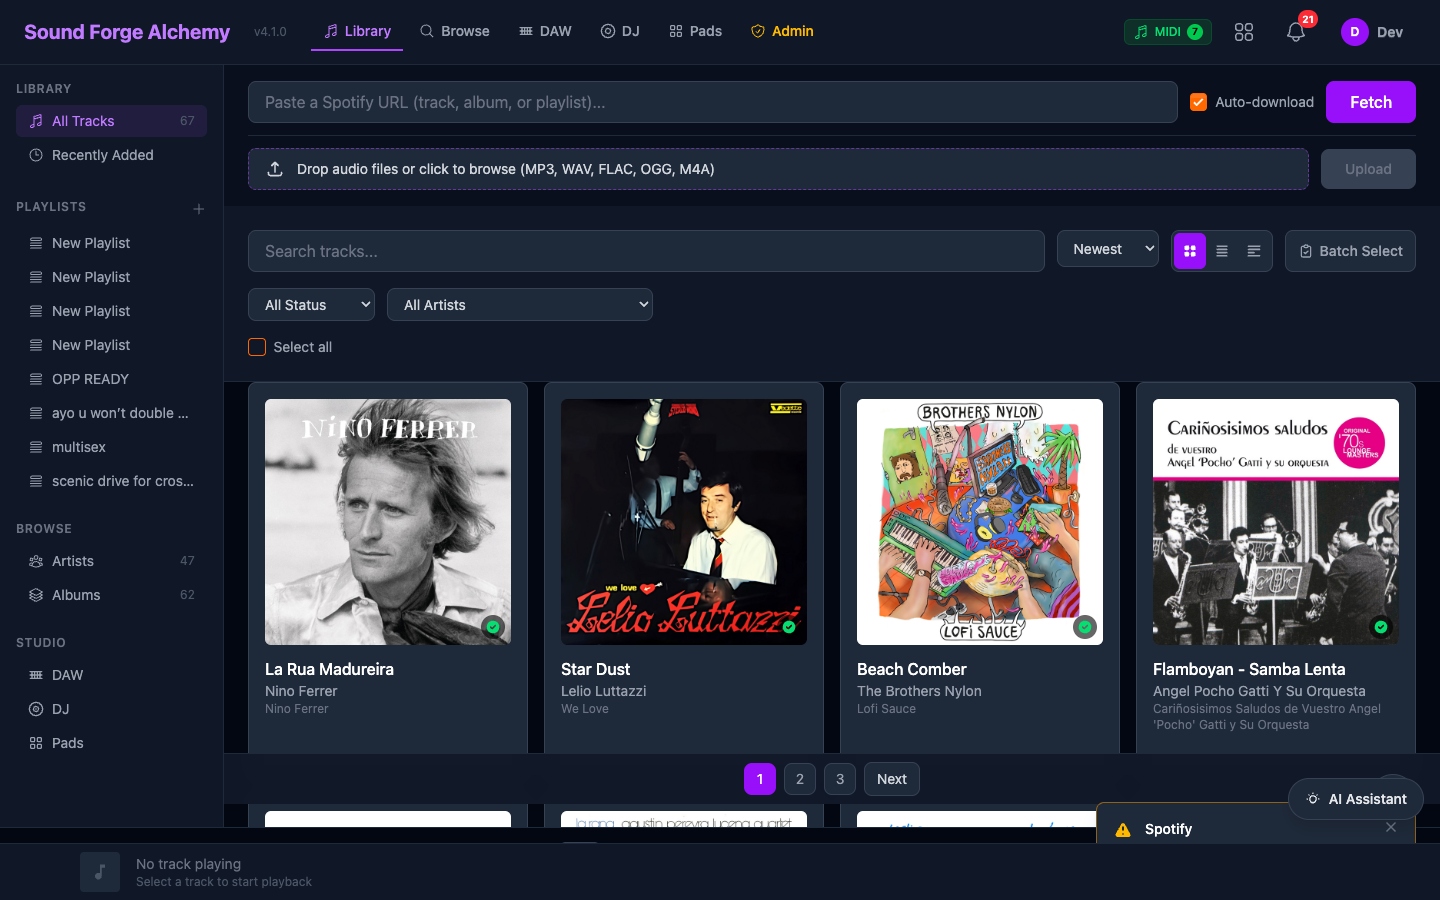 The track library at
 /. Click any downloaded track to open the detail view, which displays the D3.js analysis charts (radar, chroma, beats, MFCC, spectral) once analysis has run.
Feature Categories
The analyzer supports seven feature categories. Request by name when calling analyze/2:
| Feature | Description | librosa Function |
|---|---|---|
tempo |
BPM detection with beat tracking | librosa.beat.beat_track |
key |
Musical key detection (Krumhansl-Schmuckler) | Chroma + key profile correlation |
energy |
RMS energy + zero-crossing rate | librosa.feature.rms, zero_crossing_rate |
spectral |
Spectral centroid, rolloff, bandwidth, contrast | librosa.feature.spectral_* |
mfcc |
13 Mel-frequency cepstral coefficients | librosa.feature.mfcc |
chroma |
12-bin pitch class energy (chromagram) | librosa.feature.chroma_stft |
all |
All features above | All of the above |
Feature Output Details
tempo
{"tempo": 128.0, "beat_frames": [0, 42, 84, ...]}
key
{"key": "A minor", "key_confidence": 0.82}
energy
{"energy": 0.74, "zero_crossing_rate": 0.12}
spectral
{
  "spectral_centroid": 1823.4,
  "spectral_rolloff": 4200.1,
  "spectral_bandwidth": 2100.5,
  "spectral_contrast": [12.4, 18.2, ...]
}
mfcc
{"mfcc": [[23.4, 18.2, -5.1, ...], ...]} // 13 coefficients × N frames
chroma
{"chroma": [[0.8, 0.1, 0.2, ...], ...]} // 12 pitch classes × N frames
AnalyzerPort
Module: SoundForge.Audio.AnalyzerPort (GenServer + Erlang Port)
The AnalyzerPort wraps priv/python/analyzer.py. Communication uses JSON over stdin/stdout.
API
# Analyze specific features
AnalyzerPort.analyze("/path/to/audio.wav", ["tempo", "key", "energy"])
# {:ok, %{tempo: 128.0, key: "A minor", energy: 0.74, ...}}

# Analyze all features
AnalyzerPort.analyze("/path/to/audio.wav", ["all"])
# {:ok, %{tempo: ..., key: ..., energy: ..., mfcc: ..., chroma: ..., spectral: ...}}
Timeout
Analysis operations timeout after 2 minutes (120_000 ms). Long files may approach this limit.
Valid Features
@valid_features ~w(tempo key energy spectral mfcc chroma all)
Analysis Pipeline
AnalysisWorker (Oban, queue: :analysis, concurrency: 2)
      |
      1. Get AnalysisJob record from DB
      2. Update status -> :processing, broadcast 0%
      |
      3. Determine audio file path (from completed DownloadJob)
      |
      4. Audio.AnalyzerPort.analyze(path, features)
           |
           Erlang Port -> priv/python/analyzer.py -> librosa
           |
           Progress updates at 25%, 50%, 75%
      |
      5. Music.create_analysis_result(%{
           track_id: ...,
           analysis_job_id: ...,
           tempo: 128.0,
           key: "A minor",
           energy: 0.74,
           spectral_centroid: 1823.4,
           features: %{mfcc: [...], chroma: [...]}
         })
      |
      6. Update AnalysisJob status -> :completed, broadcast 100%
      7. PubSub broadcast triggers LiveView re-render
D3.js Visualizations
Five Phoenix JS hooks render analysis data as interactive SVG charts. Hooks are registered in assets/js/app.js and triggered via phx-hook in the track detail HEEx template.
AnalysisRadar
Hook: AnalysisRadar
Spider/radar chart displaying normalized feature scores:
- Energy
- Tempo (relative to 100–180 BPM range)
- Spectral brightness
- Rhythmic complexity (zero-crossing rate)
- Harmonic richness (chroma entropy)
AnalysisChroma
Hook: AnalysisChroma
Horizontal bar chart of mean energy per pitch class (C, C#, D, D#, E, F, F#, G, G#, A, A#, B). Highlights the detected key.
AnalysisBeats
Hook: AnalysisBeats
Timeline showing detected beat positions. Colored segments indicate bar boundaries. Useful for verifying BPM accuracy.
AnalysisMFCC
Hook: AnalysisMFCC
Color heatmap of 13 MFCC coefficients over time. Dark blue = low energy, bright yellow = high energy. Reveals timbral texture across the track.
AnalysisSpectral
Hook: AnalysisSpectral
Line chart overlaying spectral centroid (brightness) and spectral rolloff over time. Shows how the frequency content shifts through the track.
AnalysisResult Schema
Typed columns store commonly queried features; the features JSONB column stores high-dimensional data.
| Column | Type | Description |
|---|---|---|
tempo |
float | BPM |
key |
string | e.g., "C major", "F# minor" |
energy |
float | Normalized RMS (0.0–1.0) |
spectral_centroid |
float | Hz — brightness indicator |
spectral_rolloff |
float | Hz |
zero_crossing_rate |
float | 0.0–1.0 |
features |
jsonb | MFCC, chroma, extended data |
Querying Analysis Data
# Get latest analysis for a track
result = Music.get_latest_analysis_result(track_id)
result.tempo        # 128.0
result.key          # "A minor"
result.features     # %{"mfcc" => [...], "chroma" => [...]}

# Get tracks with high energy
Music.list_tracks_by_energy(min: 0.7)

# Export analysis as JSON
GET /export/analysis/{track_id}
# Returns full AnalysisResult as JSON
See Also
| ← Stem Separation | Next: DJ/DAW Tools → |